Large-Format (600–1,000 mm) Robotics & Equipment Covers: High-Tonnage Mold CapEx vs. 1000×800×600 mm Industrial SLA
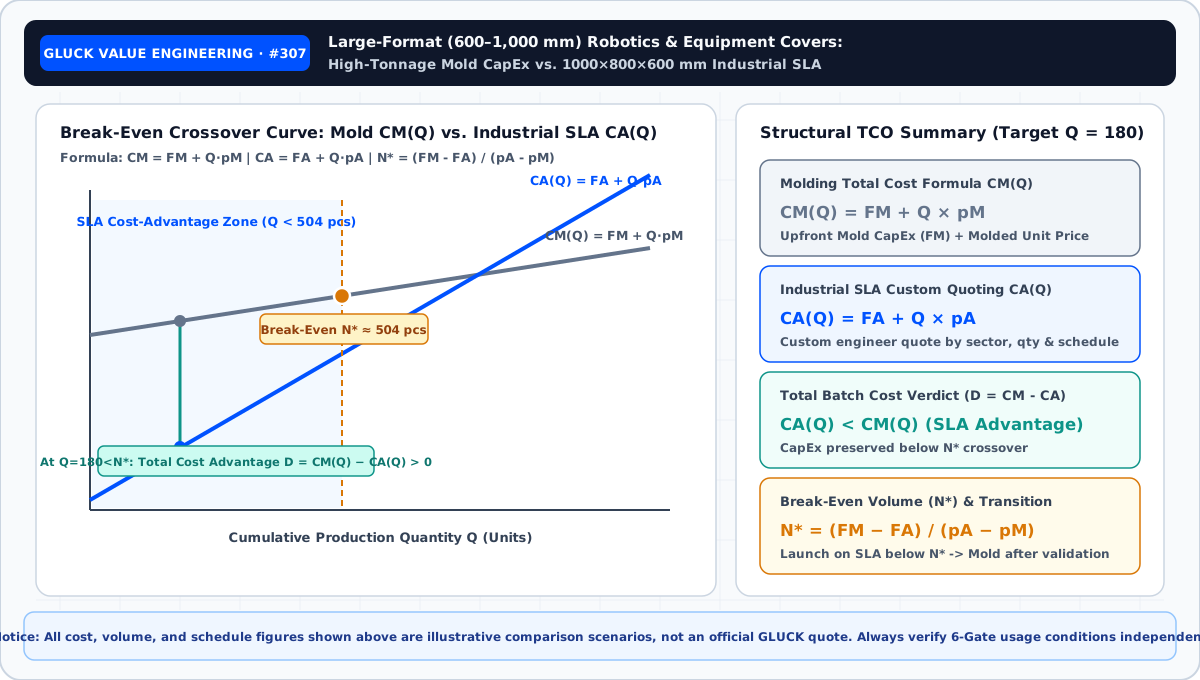
Tooling-Free Capital Preservation, Break-Even (N*) Economics & On-Demand Shift — For 800 mm autonomous robot shrouds requiring massive high-tonnage injection molds, how does break-even economics behave at 100–300 units per year?
Open full-resolution diagram ↗
Large-Format (600–1,000 mm) Robotics & Equipment Covers: High-Tonnage Mold CapEx vs. 1000×800×600 mm Industrial SLA
Executive Question & Production Value Summary: For 800 mm autonomous robot shrouds requiring massive high-tonnage injection molds, how does break-even economics behave at 100–300 units per year? The most expensive procurement mistake in hardware commercialization is committing tens of thousands of dollars to upfront injection mold NRE (FM) and high minimum order quantities (MOQ) before market demand and physical geometry are frozen—simply because molded unit price (pM) appears lower than 3D-printed unit price (pA). Operating South Korea's premier single-site 48-machine industrial SLA smart factory (1,000,000+ cumulative parts produced, up to 1000×800×600mm / 39.4×31.5×23.6 in monolithic build volume, multi-stage wet sanding, custom Pantone/RAL polyurethane painting, and Creaform 3D laser scan inspection), GLUCK empowers engineering and procurement teams to preserve upfront capital below break-even (Q < N*), execute agile Rev A → Rev B → Rev C updates between lots, stage deliveries across K releases, and validate every candidate through a rigorous 6-Gate Usage Condition Verification protocol.
1. Structural Value Math: Break-Even (N*), Revision Agility & Carryover Inventory
Rather than comparing unit prices in isolation, hardware decision-makers evaluate total batch cost (CM vs. CA), post-ECO revision cost (UM vs. UA), split-release carryover inventory (I[t]), and multi-SKU tooling exposure. (※ Custom Quoting Principle: Because industrial SLA bridge and production quotes vary completely by industry sector, application, part geometry, finishing scope, quantity, and delivery schedule, GLUCK does not expose fixed unit-price tables or auto-calculators—providing tailored engineer-led TCO evaluations per 3D CAD.)
- Total Batch Cost Equations (
CMvs.CA): Injection MoldingCM(Q) = FM (Mold NRE) + Q × pMvs. Industrial SLACA(Q) = FA (Digital Setup/FAI) + Q × pA. - GLUCK Custom Engineer Quoting Policy (No Fixed Unit-Price Tables or Auto-Calculators): Industrial SLA bridge and production quotes (
FA,pA) are never generated by generic automated calculators. Because build-tray nesting density, support strategy, and finishing workflows vary completely by industry, application sector (robotics, medical, electronics, mobility, capital equipment), part geometry, cosmetic tier (Zone A/B masking), order quantity (Q=180 units), and delivery schedule, GLUCK provides a tailored engineer-led TCO evaluation from your 3D CAD. - Sub-Break-Even Verdict (
Q = 180 units < N*): Below the break-even threshold (N*), moldless industrial SLA (CA < CM) preserves upfront working capital and eliminates multi-week hard-tooling lead times. - Break-Even Formula (
N* = ceil((FM - FA) / (pA - pM))): Launch initial commercial and bridge lots (Q < N*) on GLUCK's 48-machine SLA fleet, then transition to hard steel tooling once field demand and geometry are locked aboveN*.
Open full-resolution diagram ↗
2. Global Overseas Manufacturing Benchmarks & 2030 Paradigm Shift Outlook
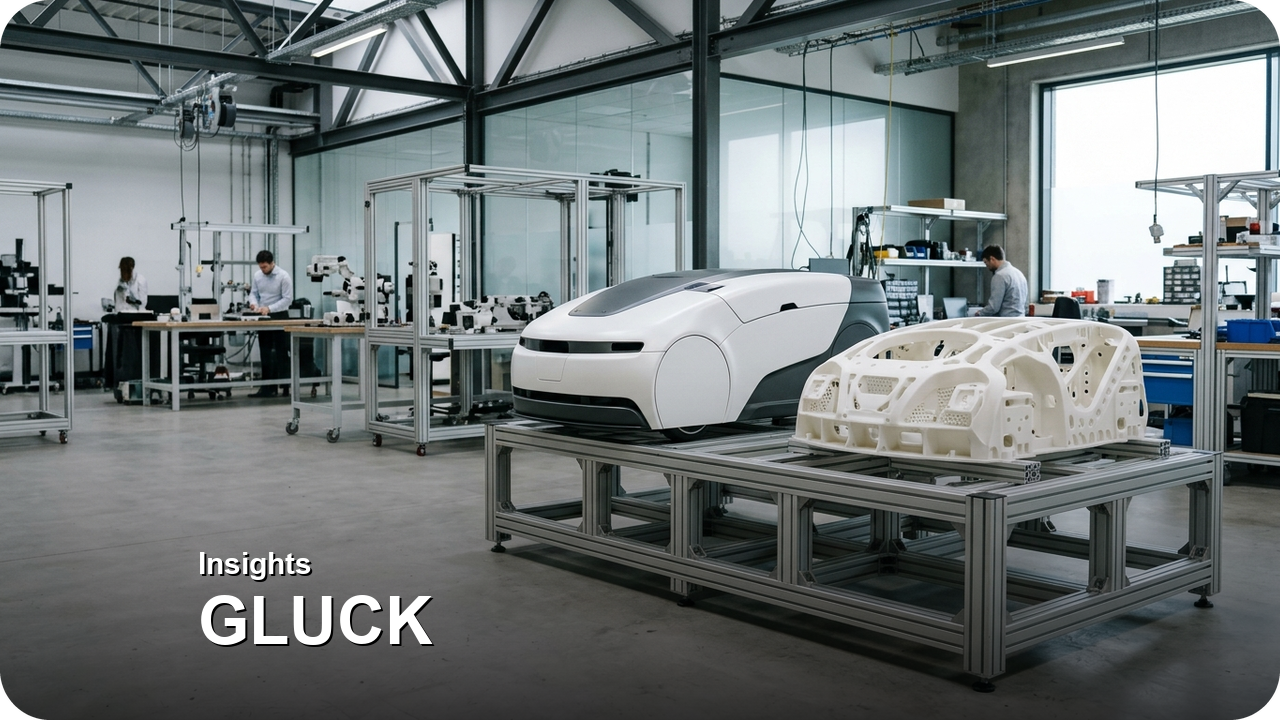
- Global Industry Benchmark (US Warehouse AMR OEM Case: Producing Full-Size Exterior Body Shells via Large-Format SLA Without $60k+ Tooling): Leading hardware, robotics, and medical device teams across North America, Europe, and Japan increasingly run commercial PVT and early production batches on industrial SLA fleets—committing to hard steel tooling only after field telemetry locks the design and demand surpasses
N*. - 2030 Manufacturing Paradigm Outlook: In B2B capital equipment, robotics, and medical carts—where parts are physically large but annual volumes stay in the hundreds—large-format industrial SLA is becoming the permanent production process rather than just a prototype step.
- GLUCK's 48-Machine Smart Factory Execution: By combining 48 industrial SLA systems under one roof with locked slice orientations, signed Zone-B masking maps, and master color plaques, GLUCK bridges the gap between 1-unit prototyping and 100–1,000+ unit series production.
Open full-resolution diagram ↗
3. Mandatory 6-Gate Usage Condition Verification (Independent of Cost N*)
Core Engineering Rule: A favorable cost comparison (CA < CM) never automatically guarantees part suitability. Before authorizing production, every part must be screened across the following 6 usage gates:
- Gate 1 (Application & Failure Consequence): Distinguish exterior covers, bezels, air ducts, and assembly jigs from high-consequence safety-critical structural components.
- Gate 2 (Mandatory Material & Certification Specs): Verify whether the blueprint mandates specific certified thermoplastics (e.g., UL94 flame ratings or medical biocompatibility) and cross-check GLUCK's website summary categories (
G20-BR,G40-JG,White,Clear) and official English PDF TDS files (G10-BR.pdf,G10-WH.pdf,G40-GW.pdf,G40-JG.pdf). - Gate 3 (Thermal, UV & Chemical Environment): Evaluate operating temperature against resin HDT (using
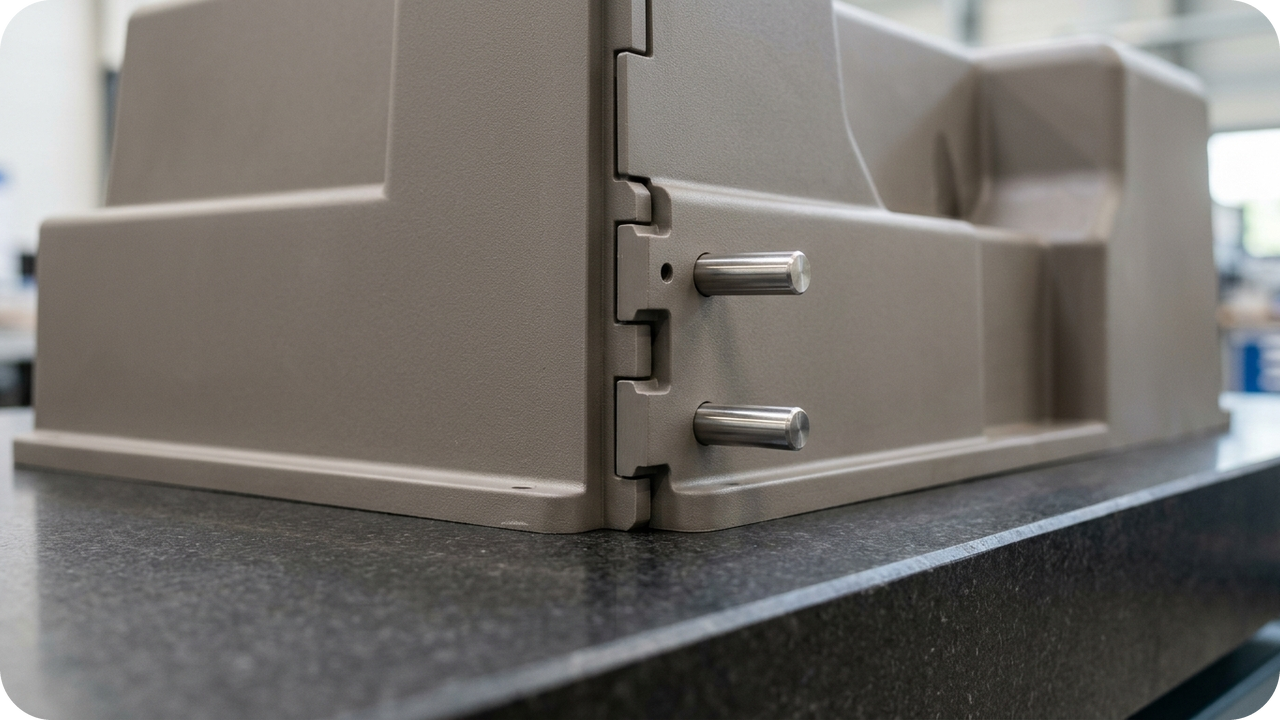
G40-JGor heat shields near warm components), and specify opaque primer plus UV/chemical-resistant polyurethane topcoats for outdoor sunlight or hospital IPA wipedowns. - Gate 4 (Long-Term Bolt Clamping Creep & Cyclic Fatigue): Prevent polymer creep relaxation and boss cracking by integrating flanged brass inserts, metallic compression limiters, or hybrid metal latches/hinges.
- Gate 5 (Dimensional Tolerance, Cosmetic Grade & Zone A/B Masking): Review datum tolerances per part geometry and separate painted cosmetic exteriors (
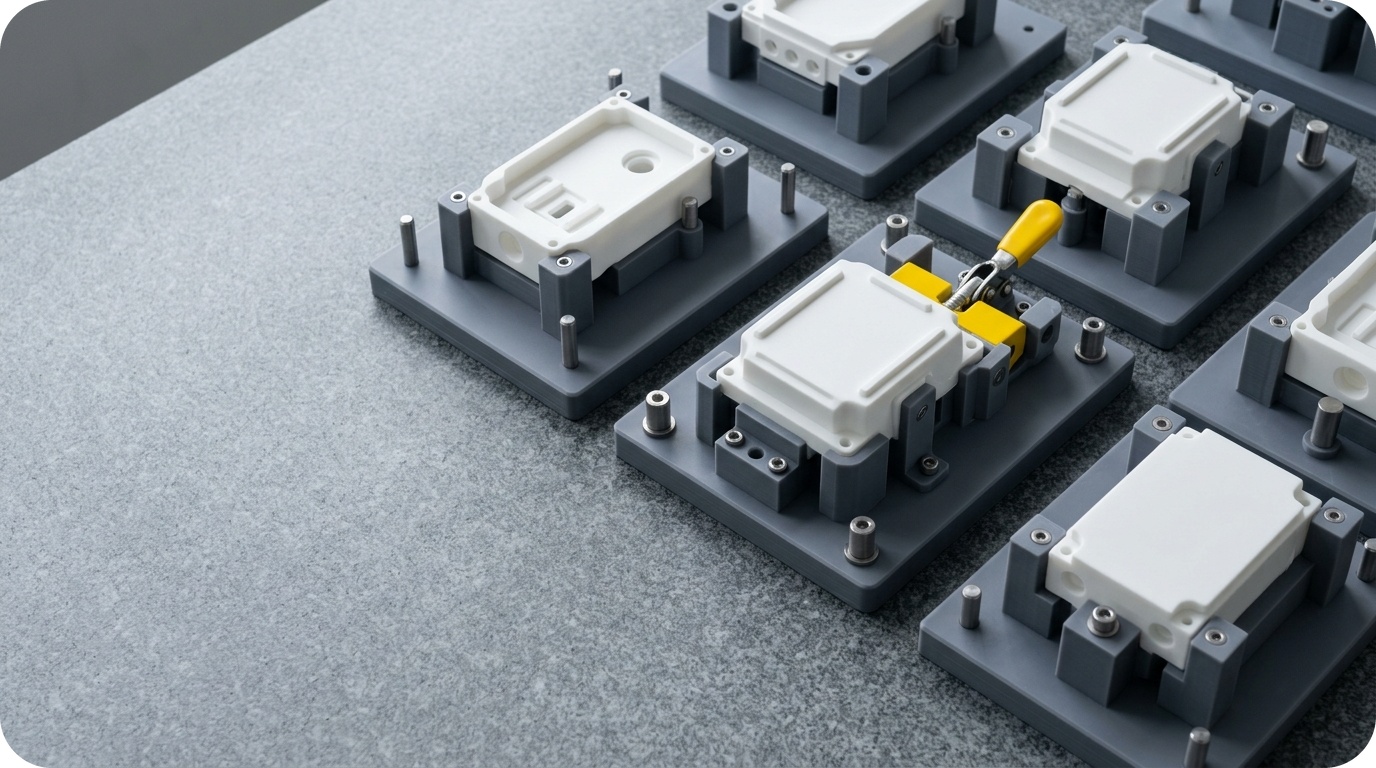
Zone A) from masked bare-resin mating interfaces (Zone B) to prevent paint-thickness interference. - Gate 6 (Pre-Production Verification & First-Article Sampling): Validate 1–5 First Article samples in actual assembly and operating conditions before releasing a 100+ unit batch.
Open full-resolution diagram ↗
Notice on Material Codes, TDS Documents & Operating Conditions: GLUCK's homepage summary table lists G20-BR (Tensile 53 MPa, Elongation 9%, HDT 59°C), G40-JG (Tensile 56 MPa, HDT 80°C), White, and Clear, while separate English PDF TDS files are published under G10-BR.pdf (Tensile 40–58 MPa, Elongation 7–12%, HDT 55–68°C @66psi), G10-WH.pdf (Tensile 49 MPa, HDT 56°C @66psi), G40-GW.pdf (Tensile 54 MPa, HDT 59°C @66psi), and G40-JG.pdf (Tensile 44–56 MPa, Flexural Modulus 2,675–2,765 MPa, HDT 80–93°C @66psi). Correspondence between homepage summary codes (such as G20-BR or White) and separate PDF filenames (such as G10-BR or G10-WH), as well as the exact resin lot, manufacturer grade, and active TDS revision, must be confirmed during pre-order consultation and should not be assumed identical without confirmation. HDT values are standard test metrics (@66psi), not continuous operating guarantees; orders of 100+ identical parts require first-article prototype validation.
4. Frequently Asked Engineering & Procurement Questions (Structured FAQ)
Q1. For 800 mm autonomous robot shrouds requiring massive high-tonnage injection molds, how does break-even economics behave at 100–300 units per year?
A1. Evaluating Large-Format (600–1,000 mm) Robotics & Equipment Covers: High-Tonnage Mold CapEx vs. 1000×800×600 mm Industrial SLA requires comparing full lifecycle equations—including upfront mold NRE (FM), digital setup (FA), revision costs (UM vs. UA), and MOQ-induced carryover stock (I[t])—rather than unit price alone. Whenever total volume is below break-even (Q < N*) or design revisions remain likely during field deployment, GLUCK's 48-machine industrial SLA smart factory preserves capital and accelerates time-to-market.
Q2. How does GLUCK balance confidential 3D CAD security with long-term repeat-order reproducibility?
A2. GLUCK operates a strict Two-Tier Data Governance Policy: standard one-off project files are automatically purged after 6 months (with immediate deletion available upon NDA security request), while pre-authorized repeat and aftermarket SKUs store locked build orientations, support maps, Zone-B masking drawings, and signed master samples for consistent re-ordering.
Q3. If custom TCO analysis shows industrial SLA is more economical than molding, can we release mass production immediately?
A3. Cost comparison and physical part qualification are two separate steps. Even when CA < CM, engineers must verify the 6-Gate Usage Conditions—thermal/UV/chemical exposure, bolt-clamping creep protection, Zone-A/B paint masking (60–120 μm / 0.0024–0.0047 in coating allowance), and 1–5 unit First Article assembly testing—before releasing full batch production.
Cluster Engineering Reference Table: Break-Even (N*) Cost Model — Injection Molding (CM) vs. Industrial SLA (CA) (Illustrative Scenario)
| Comparison Metric | Traditional Injection Molding | GLUCK 48-Machine Industrial SLA Production | Strategic Procurement Impact |
|---|---|---|---|
Upfront Fixed Cost (FM vs. FA) | Full mold tooling NRE FM paid upfront before unit #1 | Digital CAM setup & first-article check FA (no mold tooling NRE) | Preserves working capital prior to design freeze |
| Total Batch Cost Formula | CM(Q) = FM + Q × pM | CA(Q) = FA + Q × pA | Evaluates total batch outlay rather than unit price (pM) alone |
Break-Even Volume (N*) | Unit-cost advantage above Q > N* after CAD freeze | Total-cost advantage across Q < N* = (FM - FA) / (pA - pM) | Ideal for pilot/bridge runs (Q < N*) before staged transition to hard tooling |
Field Production Case Study & In-House Specimen Verification Protocol
For an annual demand of 350 rugged controller housings, the procurement and finance teams evaluated upfront mold tooling (F_M) and molded unit cost (p_M) against a tailored industrial SLA production quote C_A(Q) = F_A + Q·p_A structured around the client's industry spec, urethane finish, 350-unit batch size, and staged delivery window. Confirming Q < N*, direct SLA bridge production was selected—preserving working capital and cutting lead time by 5 weeks.
- Capturing Hidden Tooling Overheads: Includes T0/T1/T2 mold trial fees, fixture costs, and minimum-order-quantity (MOQ) surcharges when comparing CM(Q) vs. CA(Q)
- Custom Nesting & Schedule Optimization: Optimizes 3D build-tray packing and finishing workflows across 48 SLA machines according to industry sector, quantity, and delivery lead time
- Coupled Economic + 6-Gate Qualification: Pairs N* cost analysis with 6-Gate physical qualification on pre-production samples prior to batch release
Note: Client identities are anonymized under NDA. Quantitative metrics reflect representative production and specimen verification protocols at GLUCK's 48-machine Paju SLA smart factory (standard online quote bed 600×600×400 mm; large-format single-piece bed up to 1,000×800×600 mm via engineering review). Mandatory pre-production sample sign-off applies to orders of 100+ identical units.